Visualized SDO Relationships
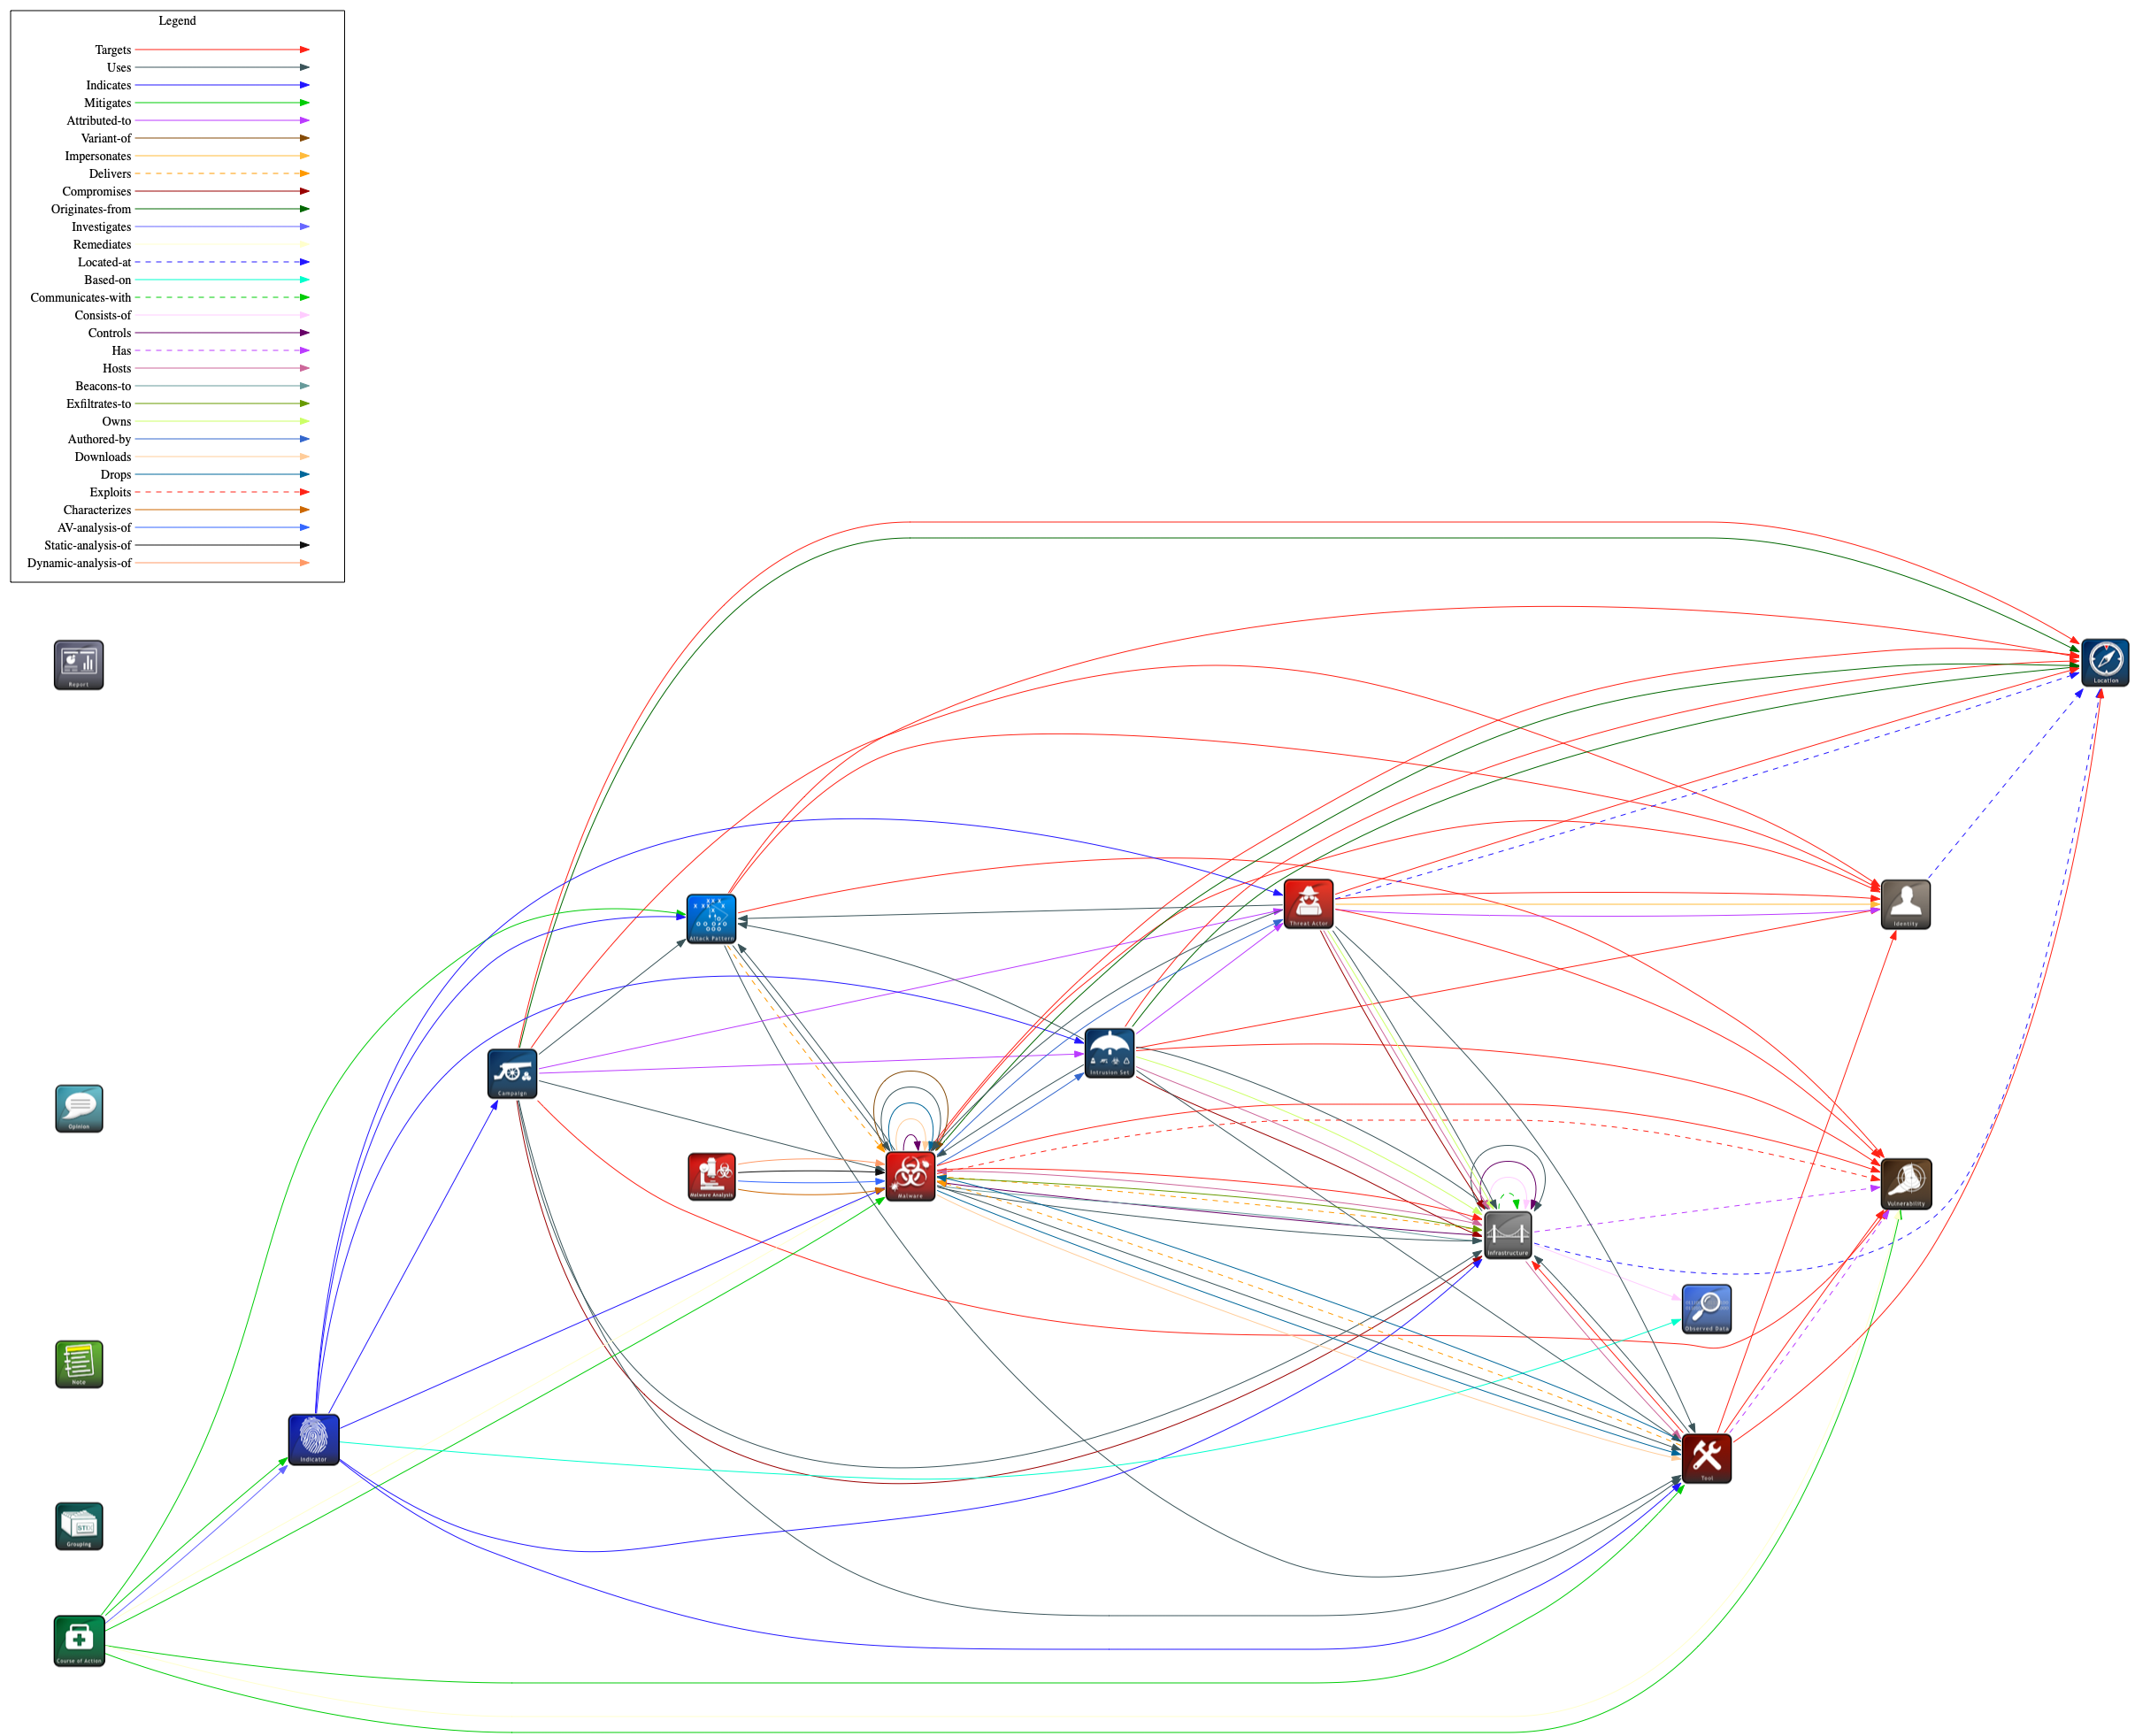
This example iterates over all SDOs and visually represents possible relationships of each SDO to another. Visual representations can simplify understanding and are often easier to interpret than text alone. All graphs were created with Graphviz. To download the Graphviz files go here.
Overview of All Relationships
The graphic below shows how each SDO fits in the overall SDO ecosystem with regard to its possible relationships.
Note: Report and Observed Data do not have any relationships.
SDO Relationships
Click the SDO in the table you wish to view.
